Use Surveys to conduct surveys within a course.
Click on New Survey to create a new survey.

You must first name your survey to be able to add questions to your survey by clicking the Add/Edit Questions button under the heading “Survey Questions”.
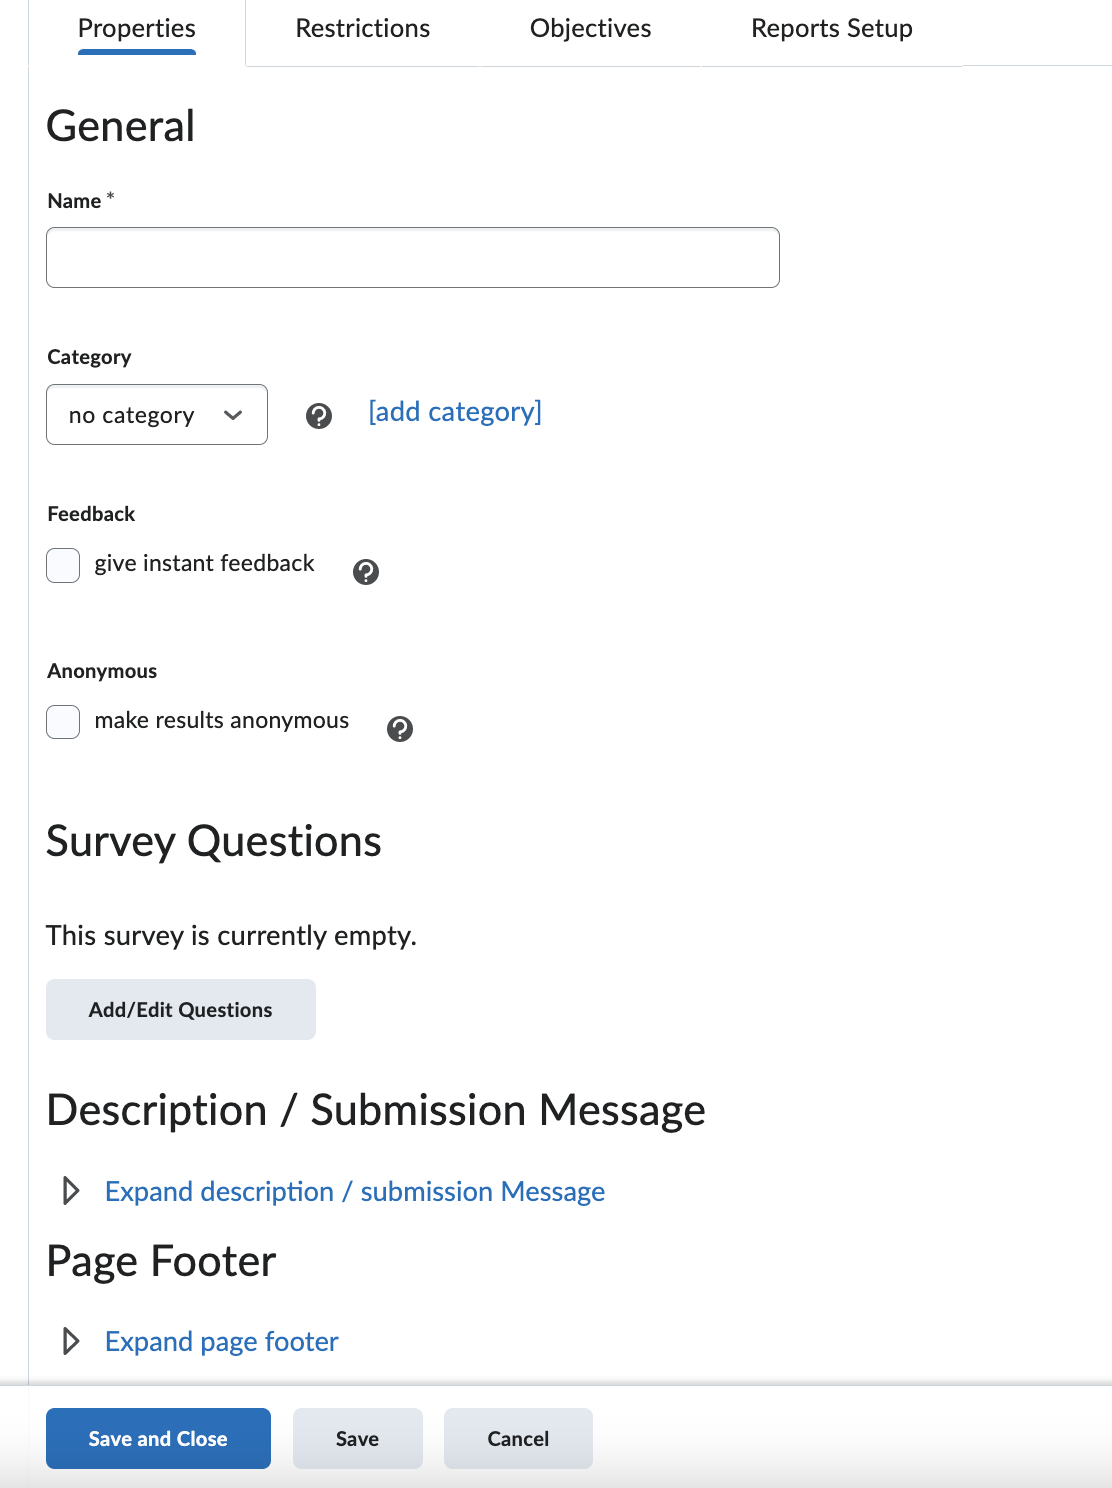
There are two ways to view the results of the survey:
- by viewing reports
- by viewing "overall results"
To view reports:
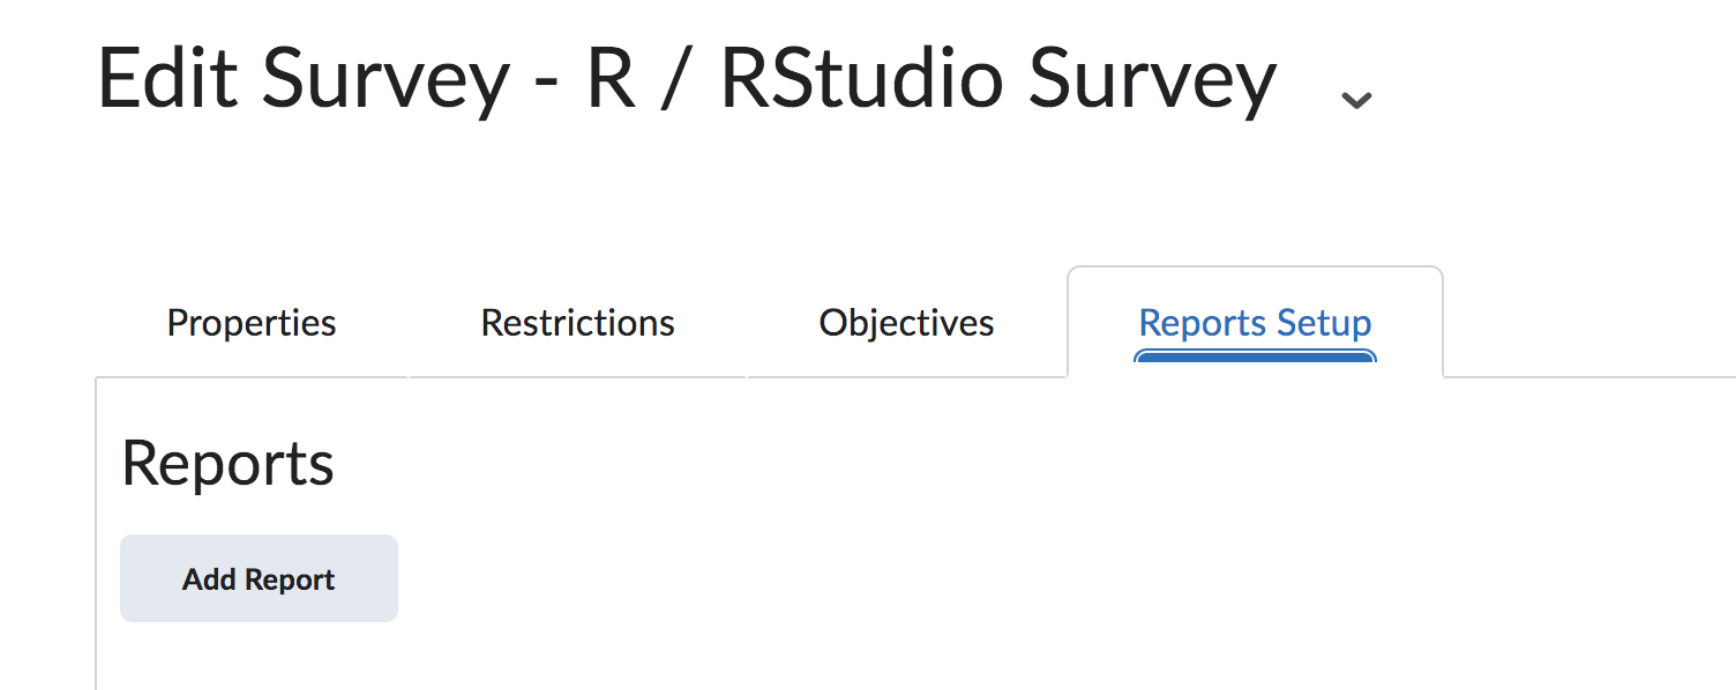
- Go to survey page, and click on the "Reports Setup" tab
- Then generate a report by clicking on “Add Report”
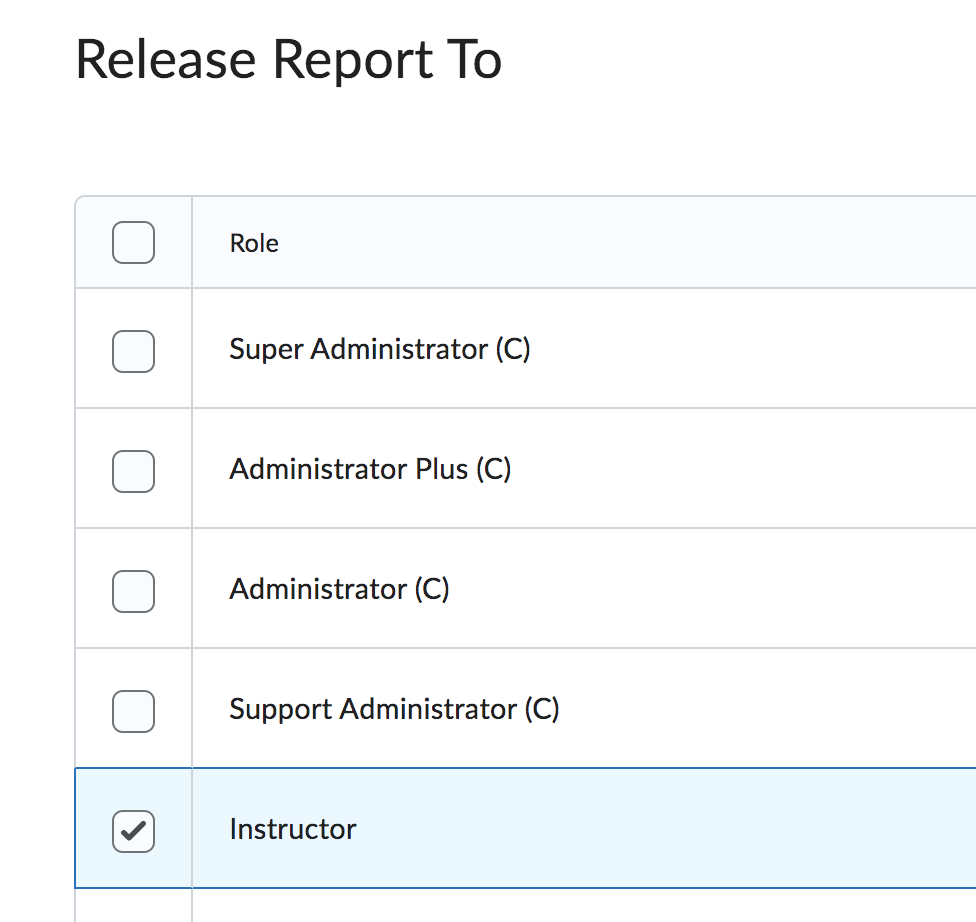
- Make sure that when you're setting up the report, to click on "Instructor" under "Release Report to" as well as anyone else who you would like to make this report available to
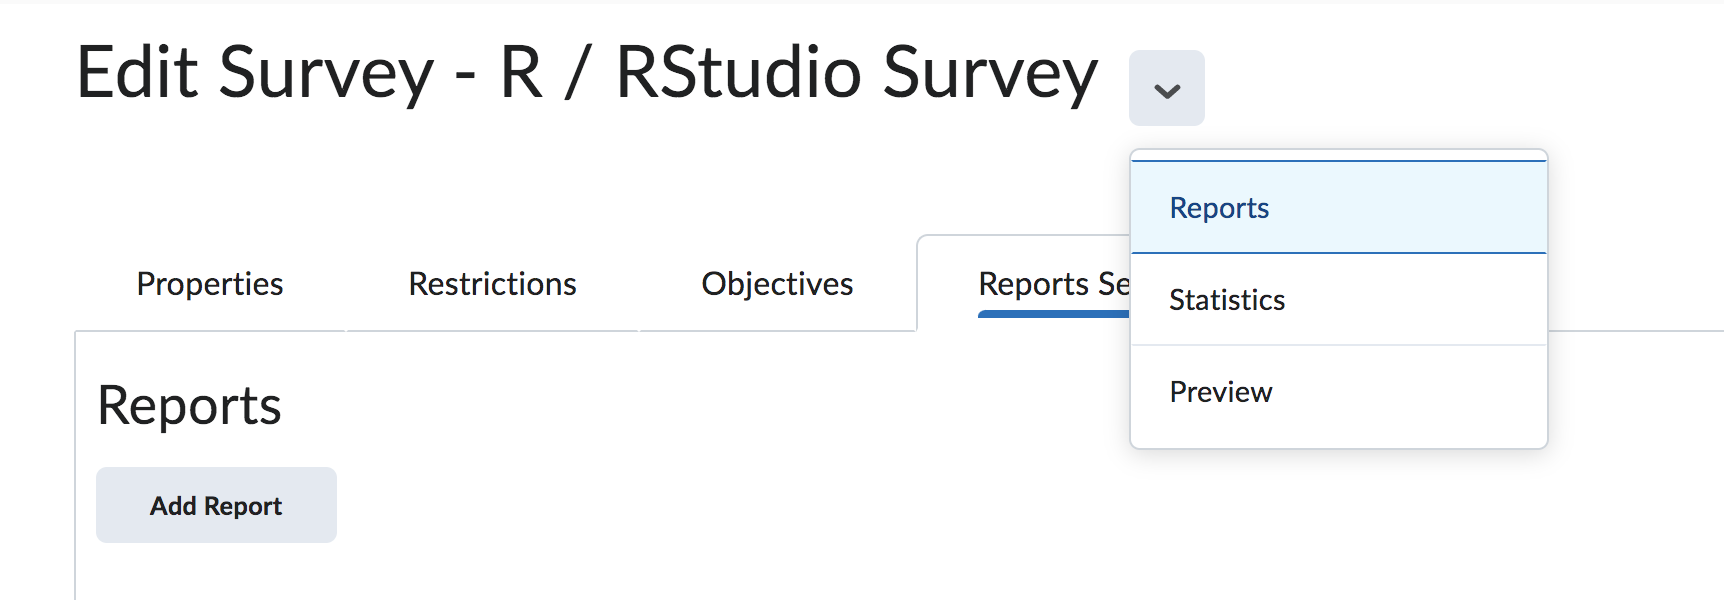
- Click on the down arrow next to the title of your survey, in this case, "Edit Survey - R /RStudio Survey", to open up menu, then click "Reports"
- You should be able to view the reports that you have created
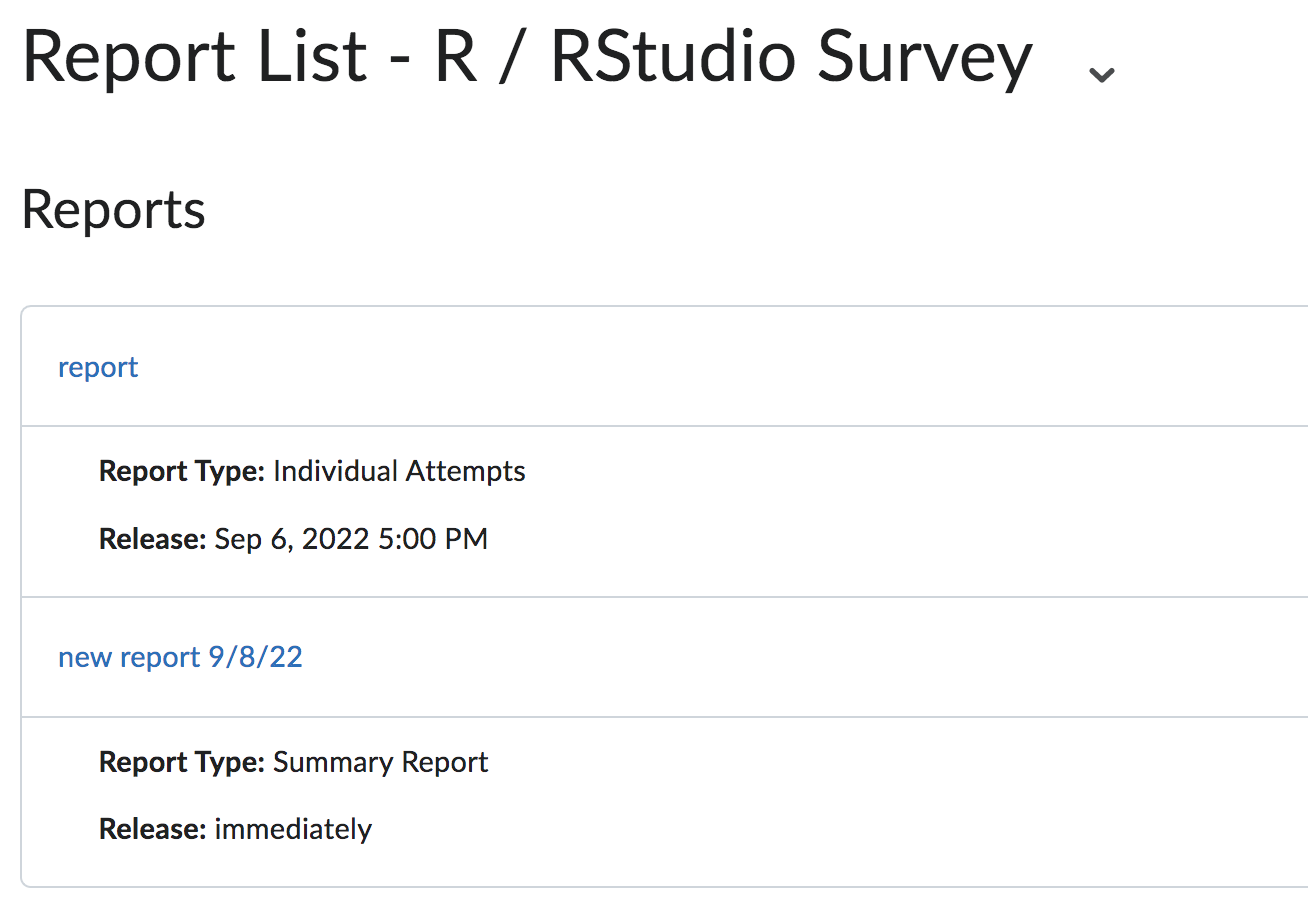
- Click on the report you want to view. Let's click "new report 9/8/22". The next page will be like this:
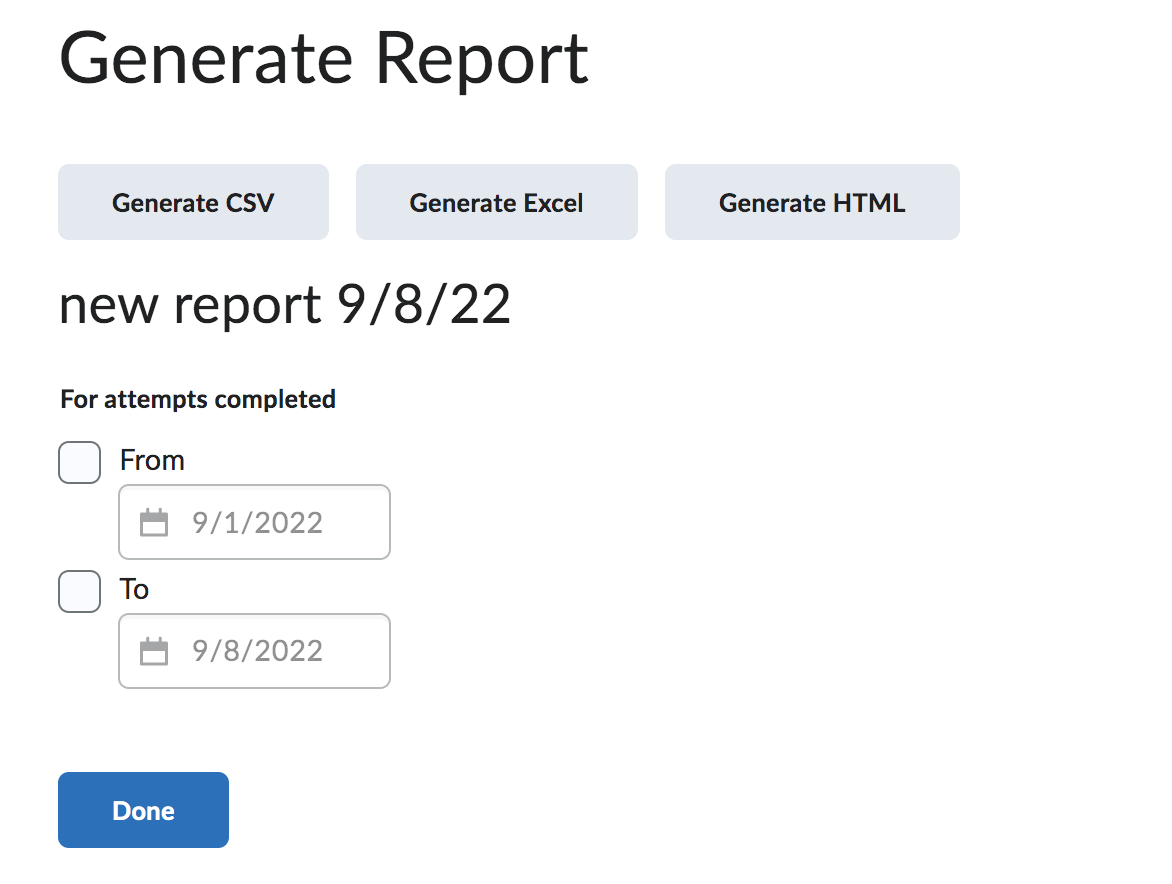
- Here you have the option of how you want the results shown. Let's click "Generate HTML" to view the results on screen. The next page will look like this. Here's your report! You can print this report or export it to csv / excel.
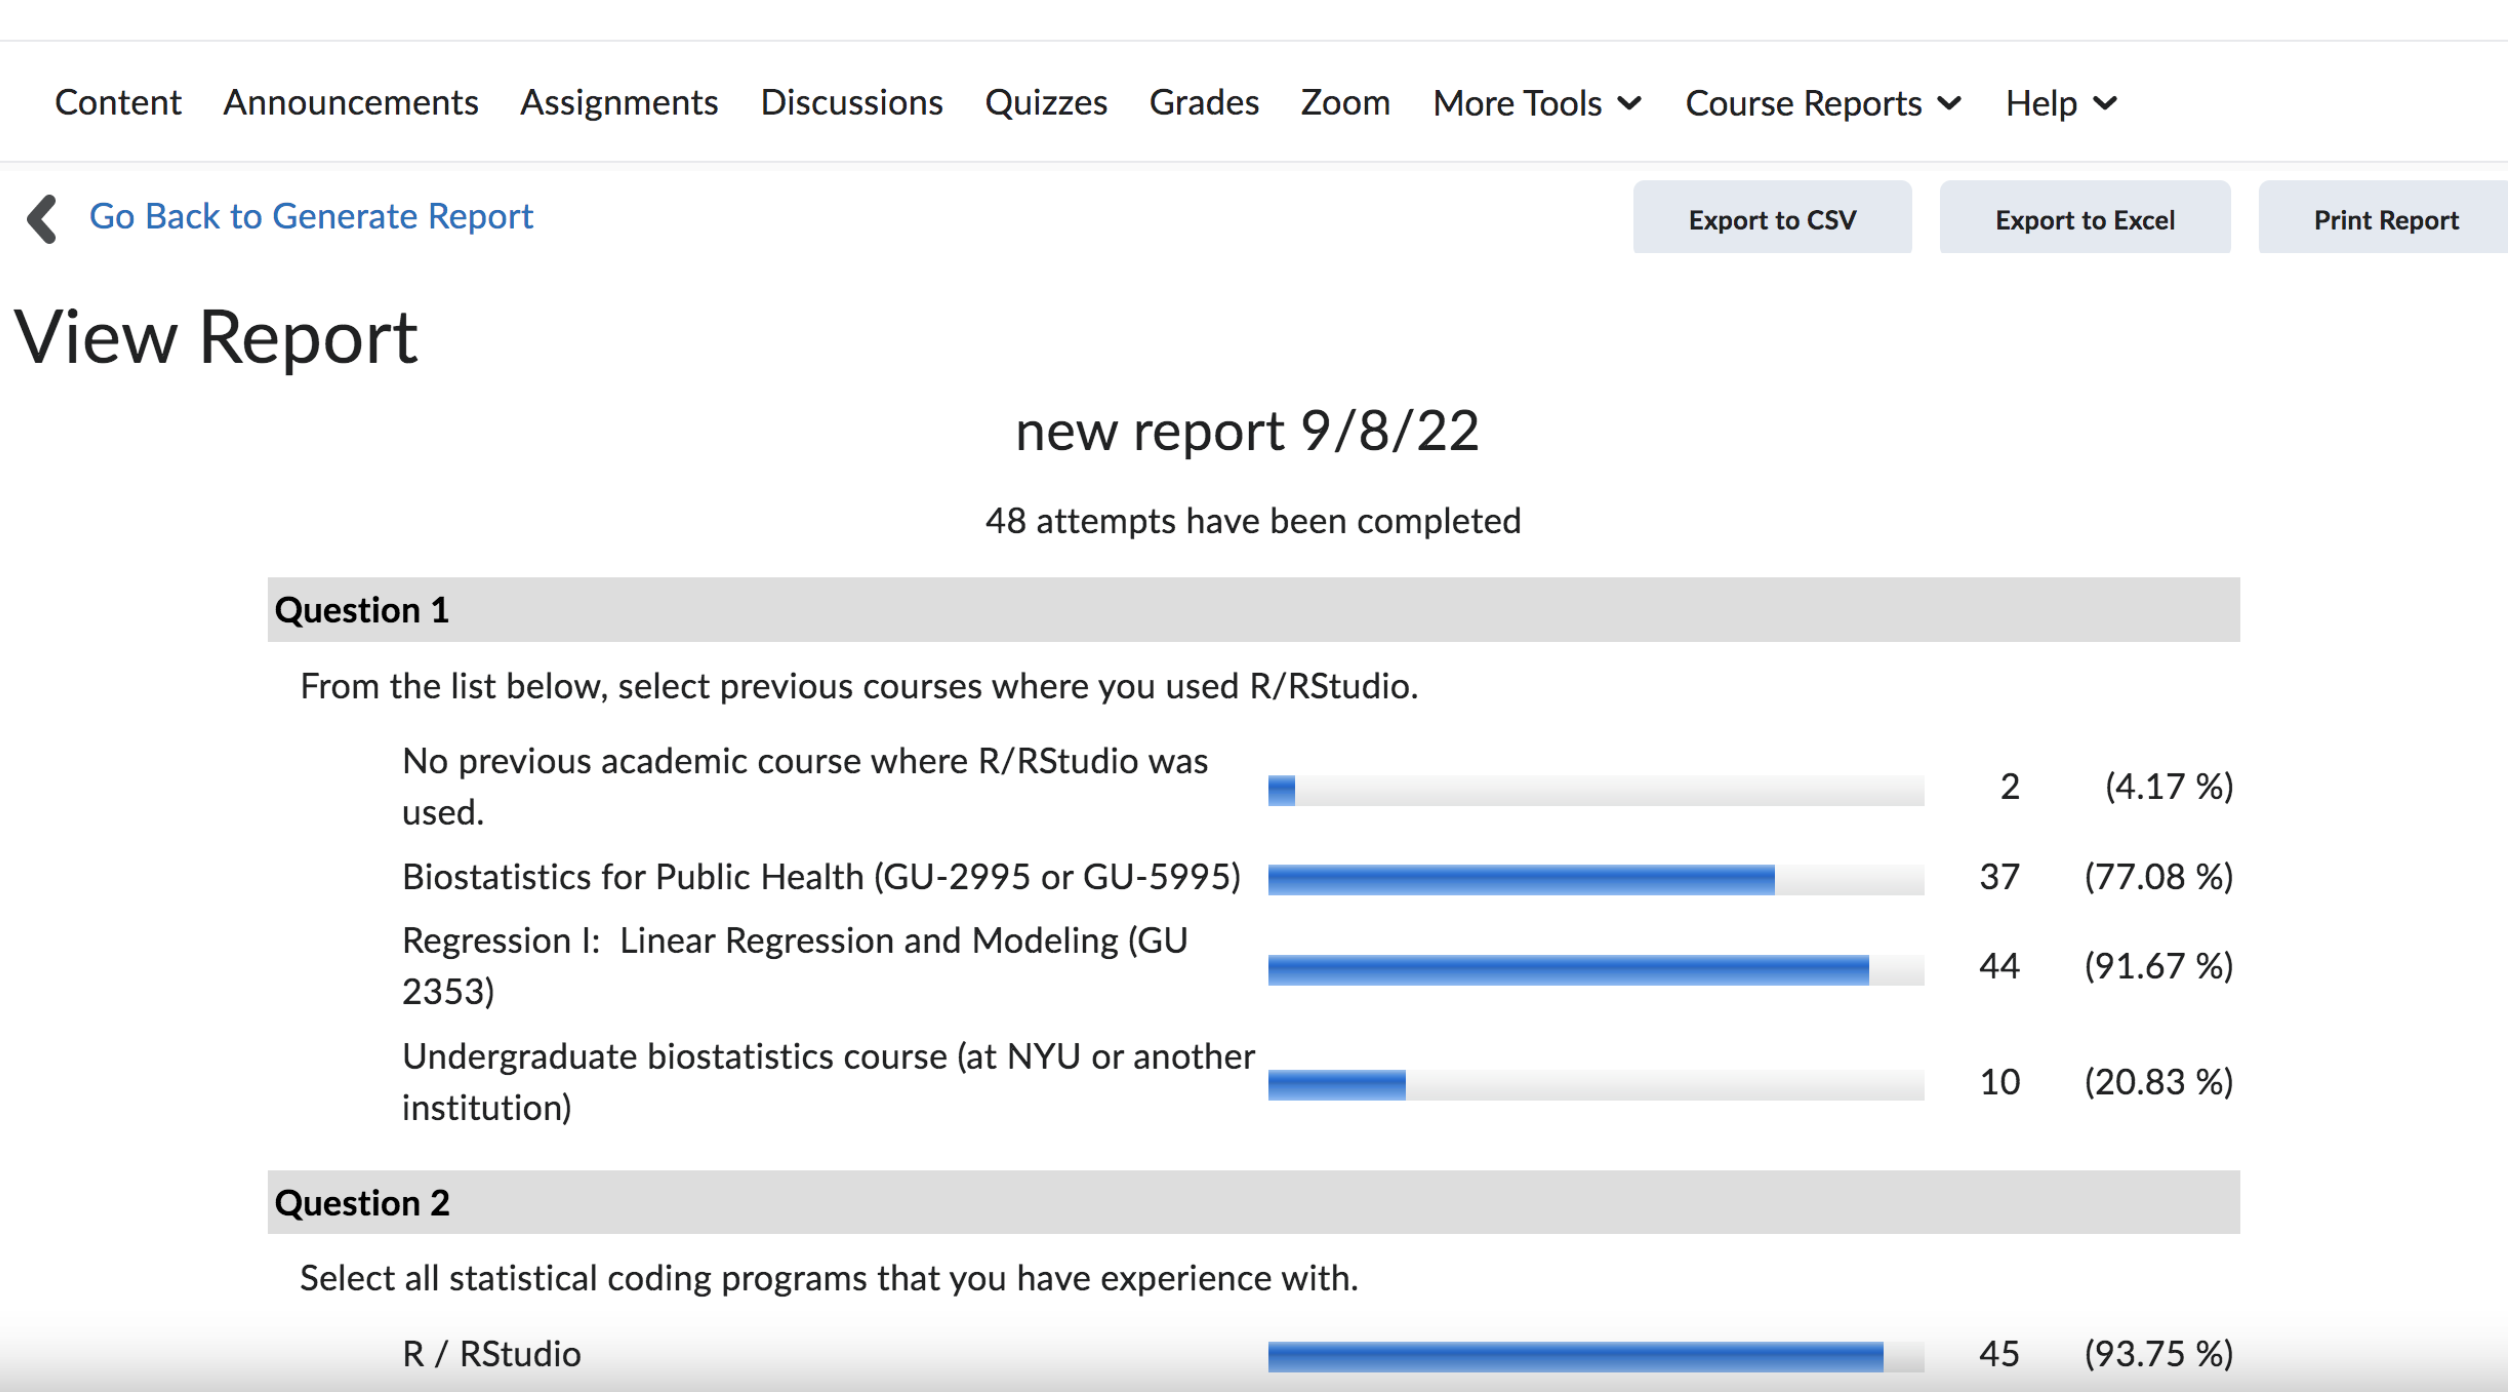
To view "overall results":
This function is a lot less complicated than the reports above, and just allows you to view the survey results. You won't be able to print it or have a saved file like a report does.
- Go to survey page
- Click on the down arrow next to the title of your survey, in this case, "Edit Survey - R /RStudio Survey", to open up menu, then click "Statistics"

- You should see something like this:
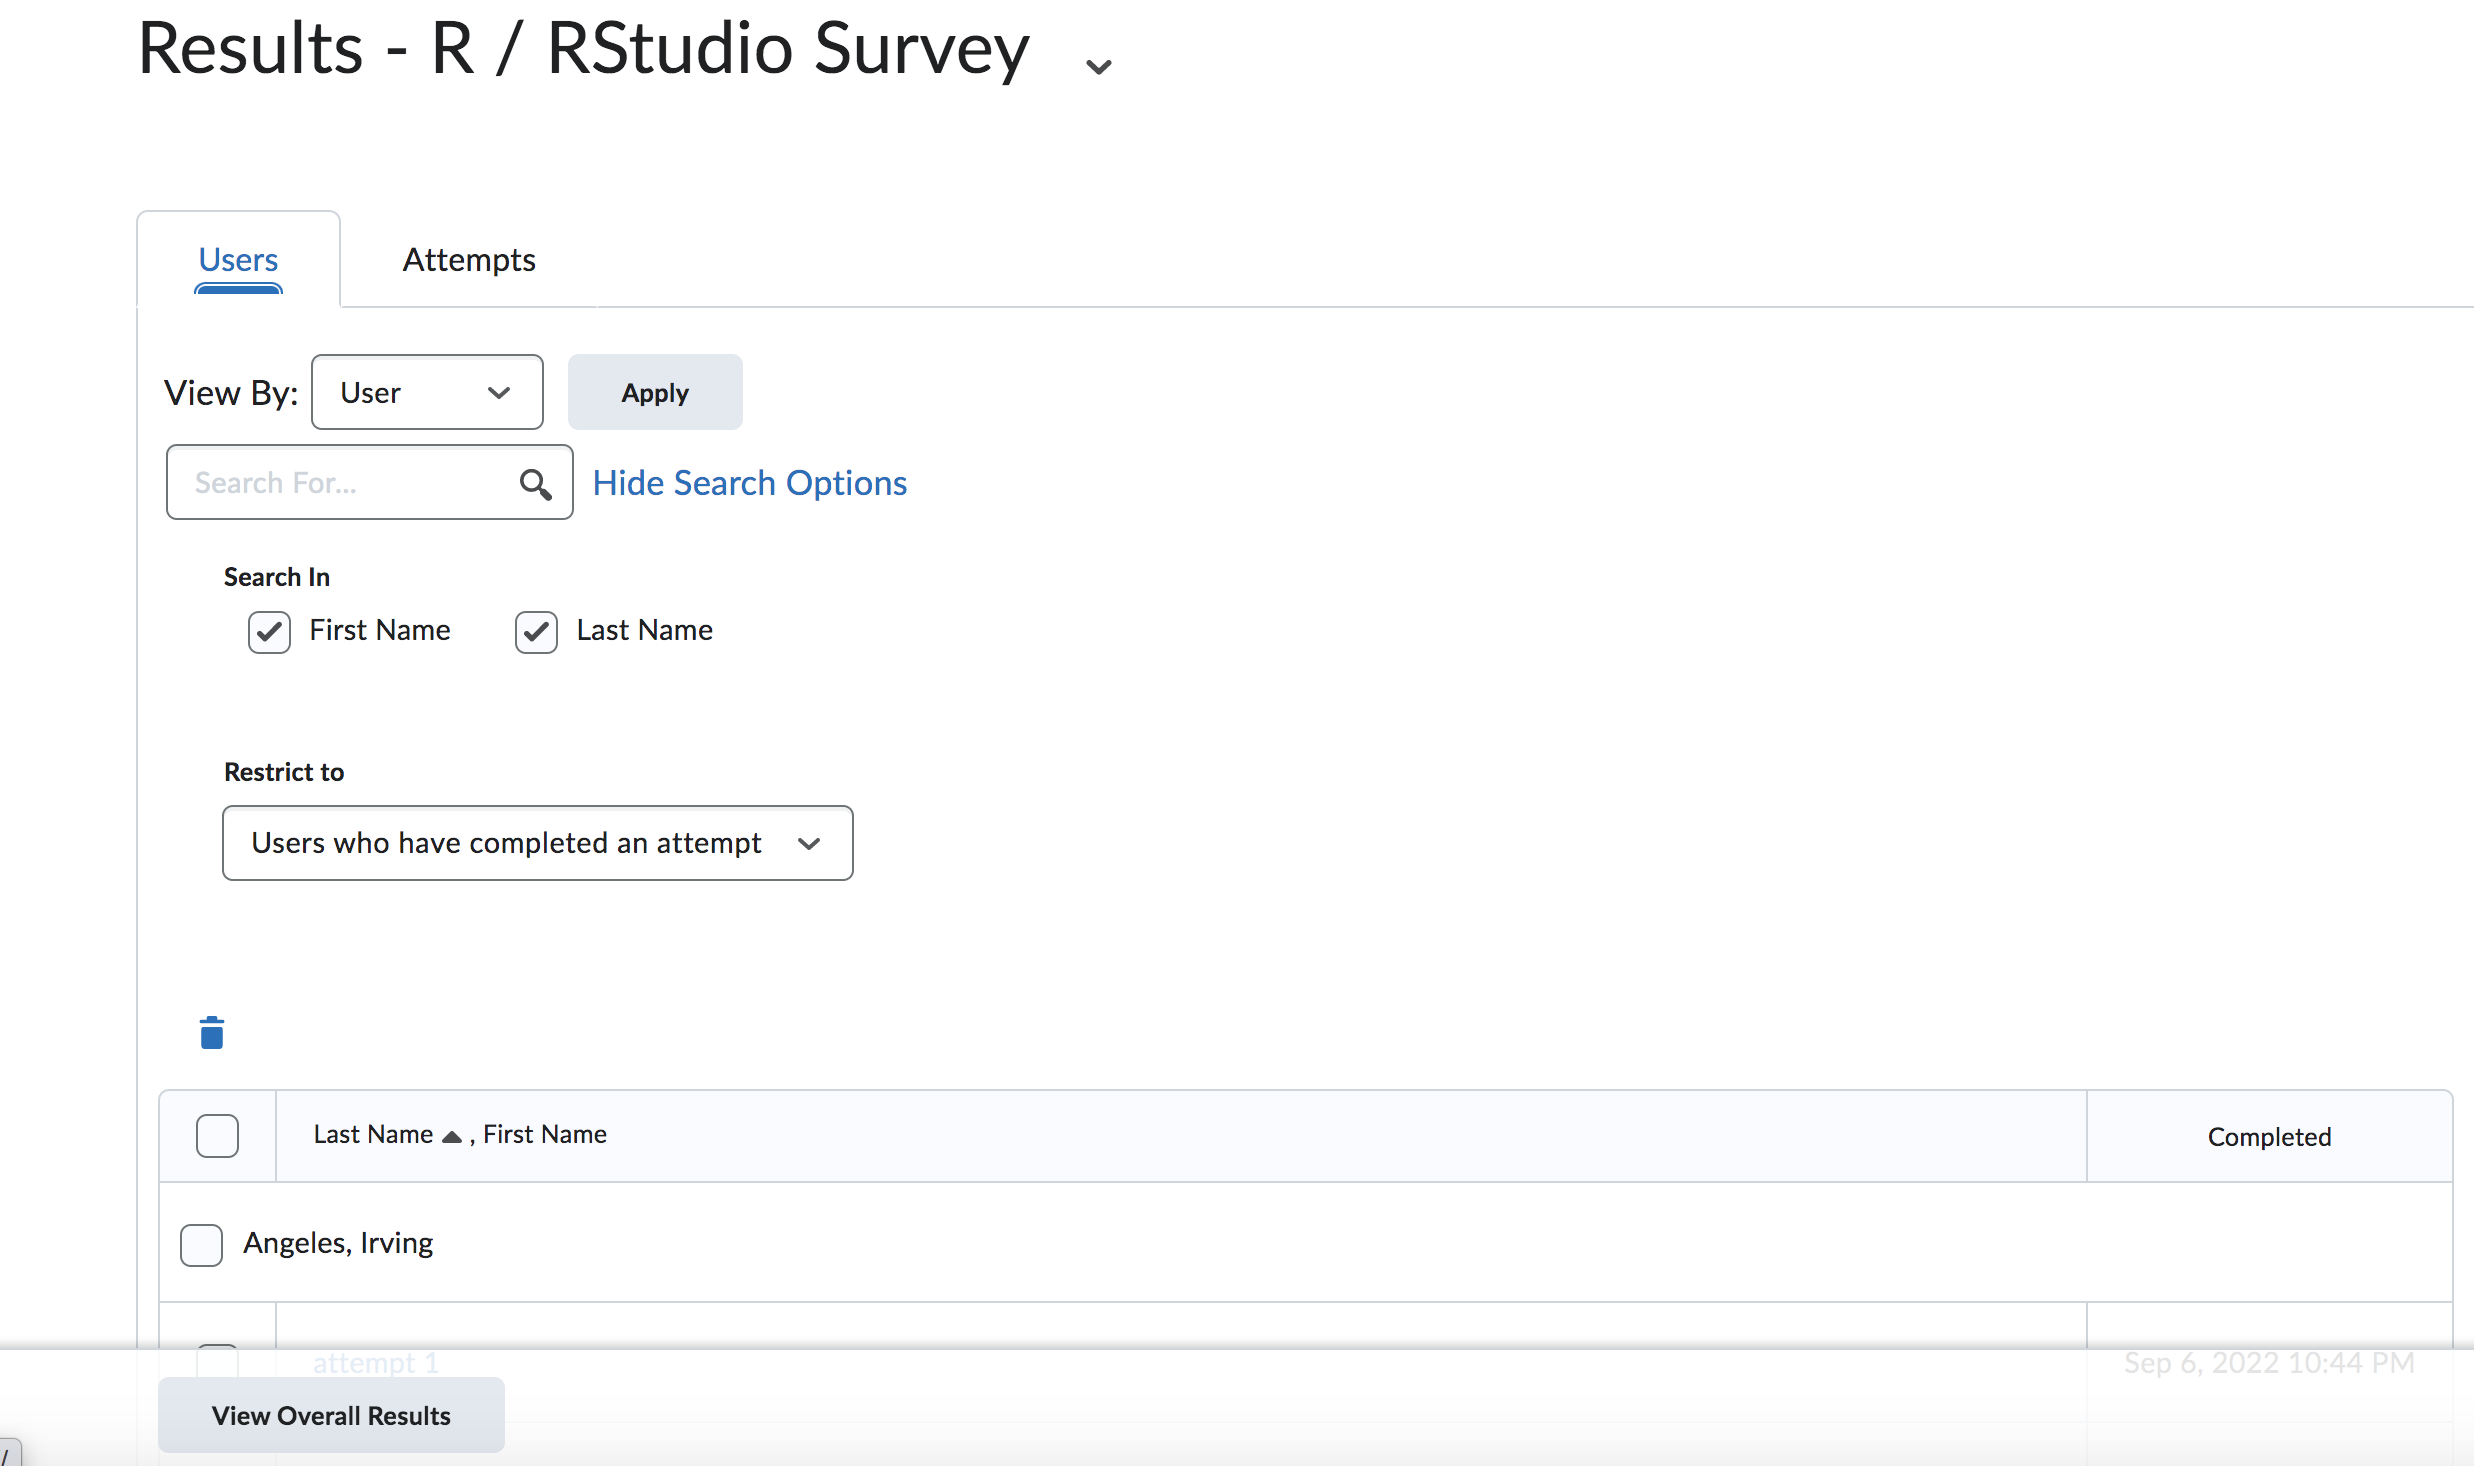
- You'll be able to view results for each individual and each attempt here: this is so you can go and understand each student's survey in the case that you want to know for example, who hasn't used RStudio before
- At the lower left hand corner there is a "view overall results" button, click on that
- This would be the page that comes up:
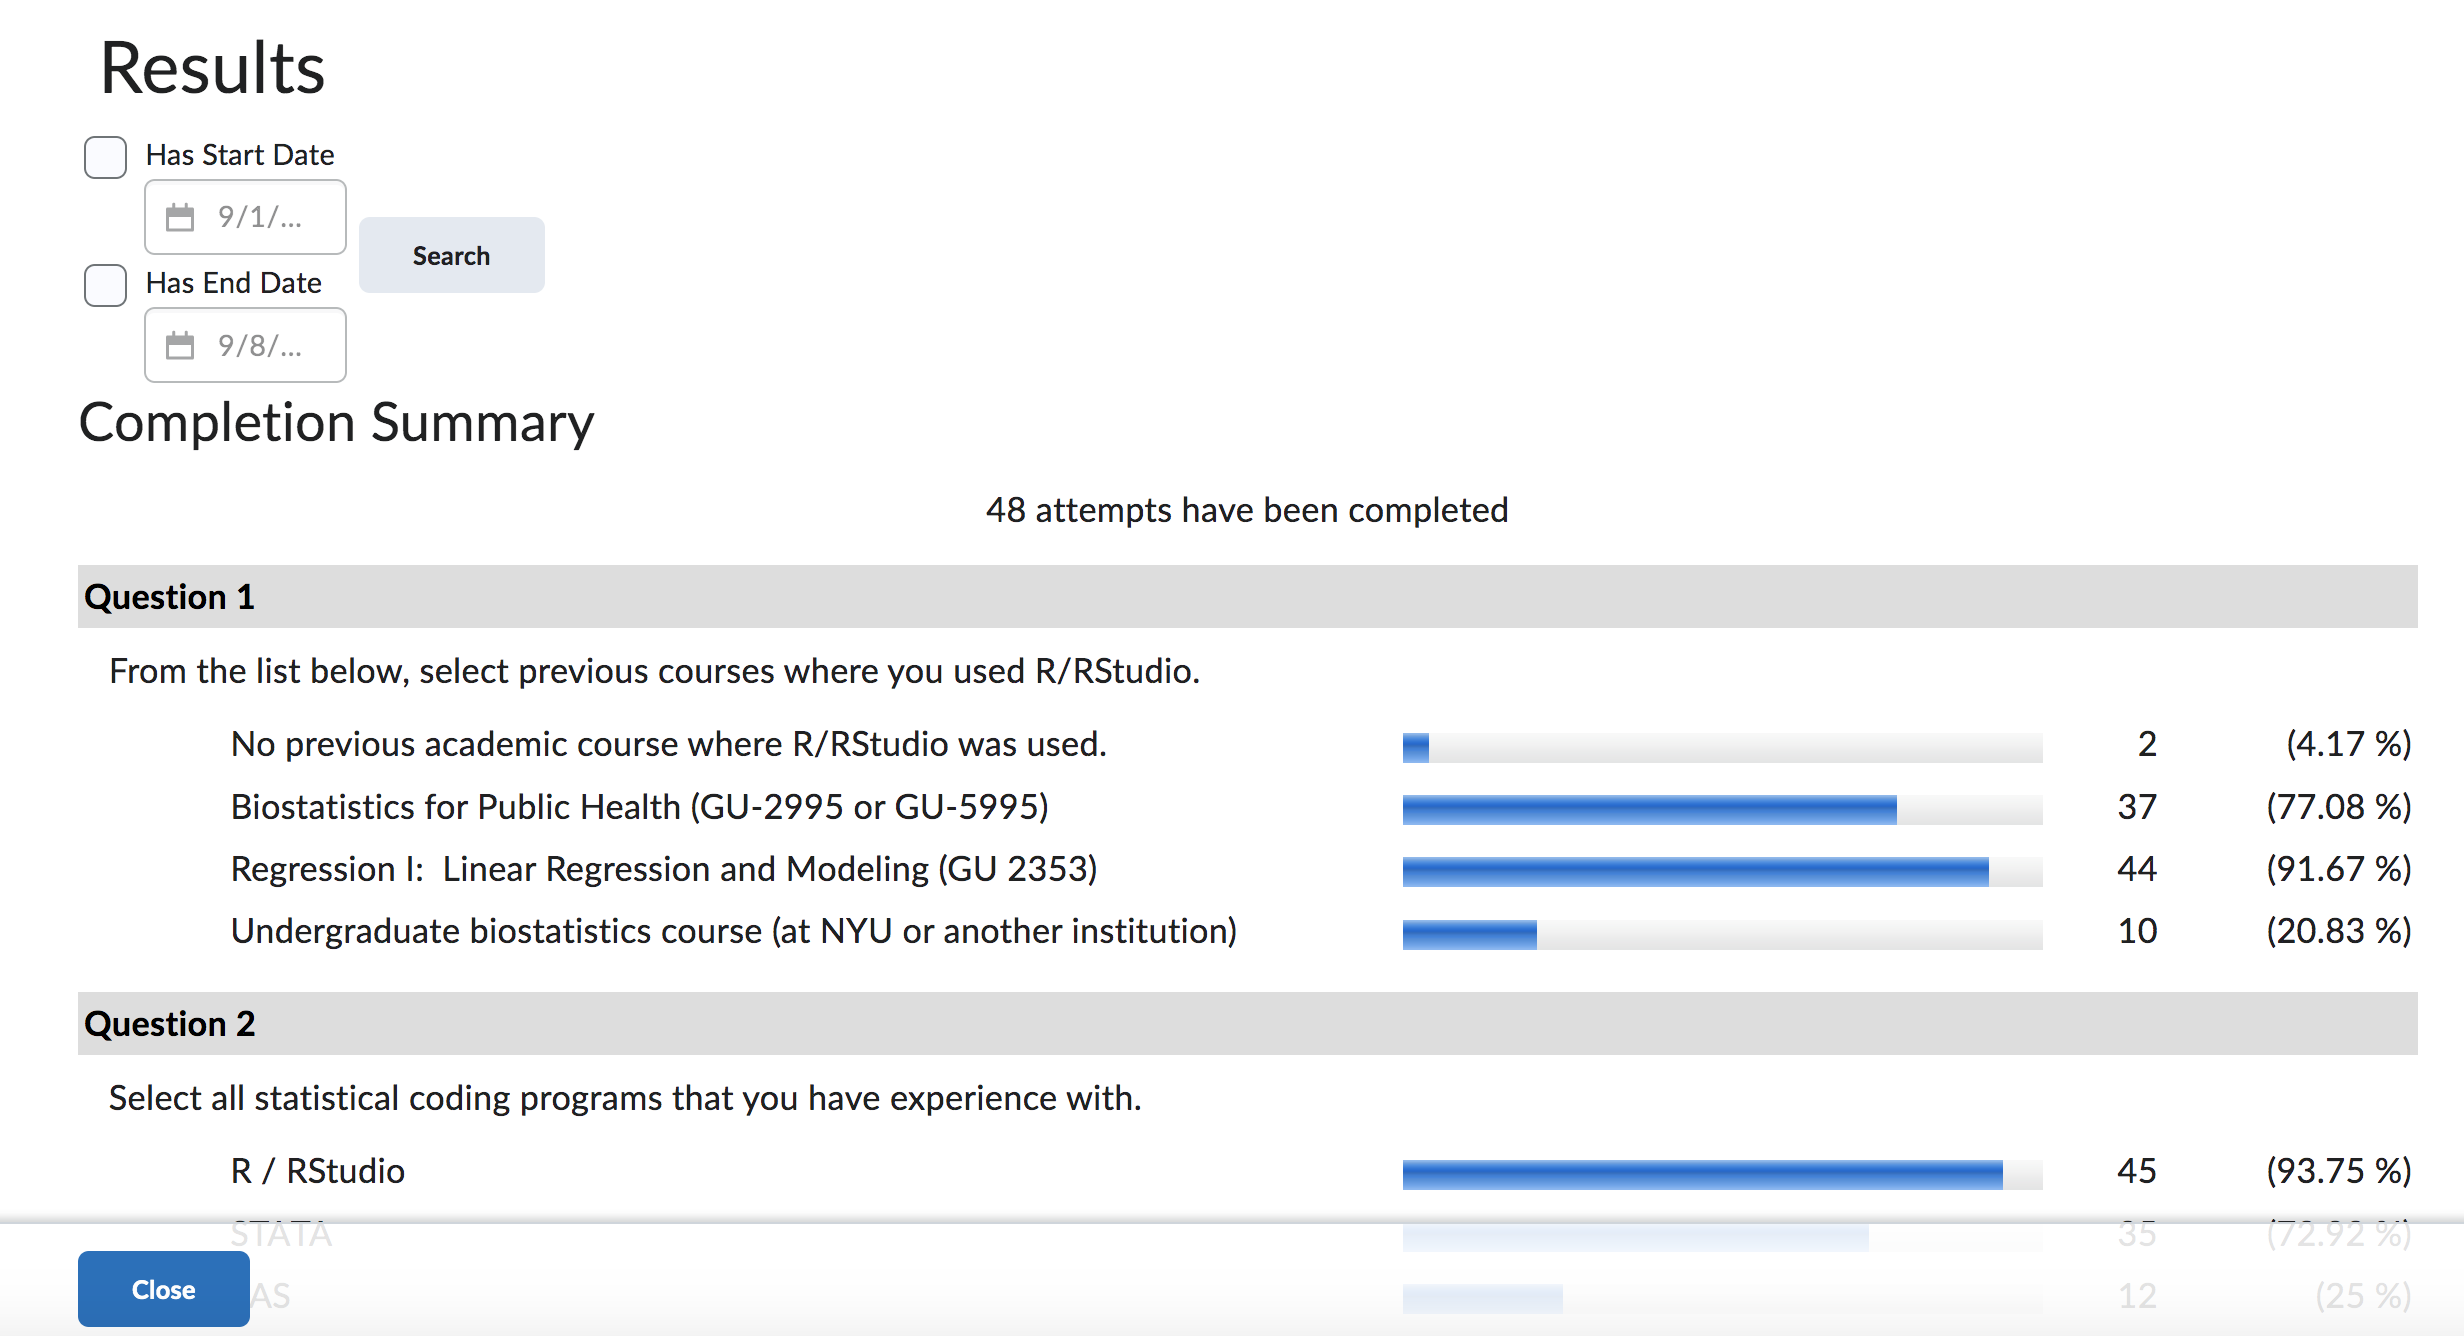
- Now you can quickly view the results of the survey at a glance!